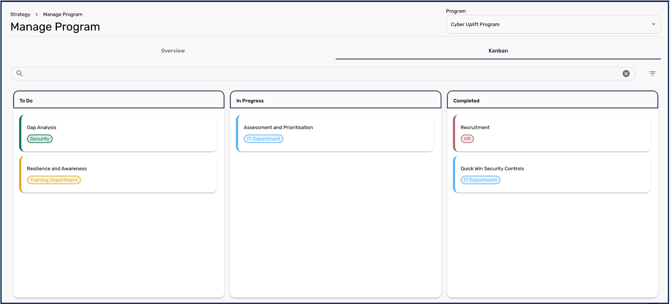
Once a program is active, the Program Management page is where you run and track it day to day. It brings together how your program is performing, what needs attention, and a board for moving work through its stages. It matters because it turns your plan into a live view of progress, cost, and the maturity and risk you are gaining, so you can keep the program on course. You will need an active program to use this page, so create or activate one first.
The Overview tab
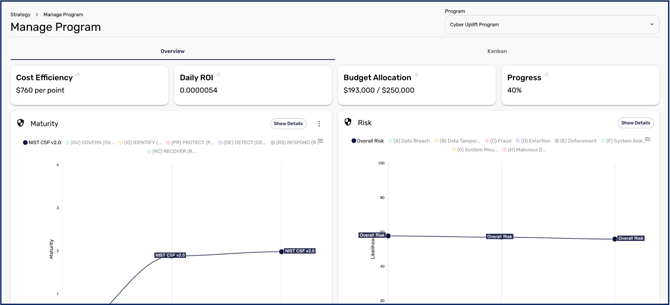
The Overview tab gives you the program's headline metrics and the work that needs attention. The key metrics are:
- Cost Efficiency: the average dollar value spent to gain one maturity point across the organisation.
- Daily ROI: the maturity gain achieved per dollar spent, on a daily basis.
- Budget Allocation: the cost of completed activities relative to the total budget set for the program.
- Progress: the percentage of the program's activities that have been completed.
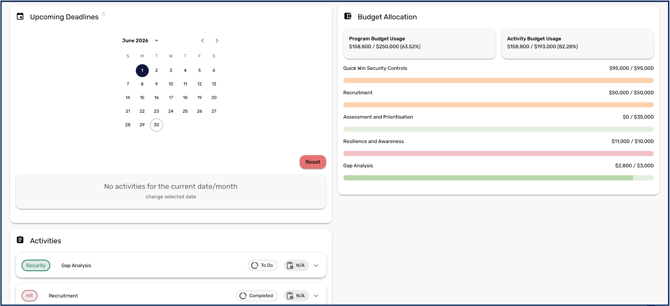
Alongside these, Maturity and Risk cards visualise how your scores are changing, and a Key Concerns card surfaces the activities that are behind schedule, over budget, or delivering the lowest return. An Upcoming Deadlines card lets you open an activity to tick off its milestones, the Activities card expands to show an activity's linked automations and current scores (a green ring marks a positive change to a control, grey marks no change, and red marks a negative change), and a Budget Allocation card breaks the spend down by activity.
The Kanban tab
The Kanban tab lets your team track activities visually as they move through your program's workflow. Drag and drop an activity to move it along the pipeline, and if an automation is linked to that transition, the associated controls change state automatically. The statuses on the board are the ones you define when you set up your workflow.
Each card shows its planned completion date, colour-coded to show at a glance whether the activity is on track, overdue, or complete. This means you can read the timing of the whole programme from the board without opening cards one at a time.
Activities can also move without anyone touching the board. If a treatment action on a risk or issue is linked to an activity with a target status, completing that action advances the activity automatically - so a card may progress because remediation work was completed elsewhere. For more information on this, see How to Configure Program Workflows and Automations.
Read together, the Program Management page tells you whether your program is delivering the maturity and risk improvement you planned, for the cost and on the schedule you set, and gives your team a single board to keep the work moving.