
The Issues Report, under Reports > Issues, summarises every issue in your workspace and shows how those issues are affecting your risk over time. It matters because it turns your day-to-day issue tracking into a reporting view you can share, making clear how many issues you carry, how quickly you resolve them, and the weight they place on your posture. This article explains how to read the report.
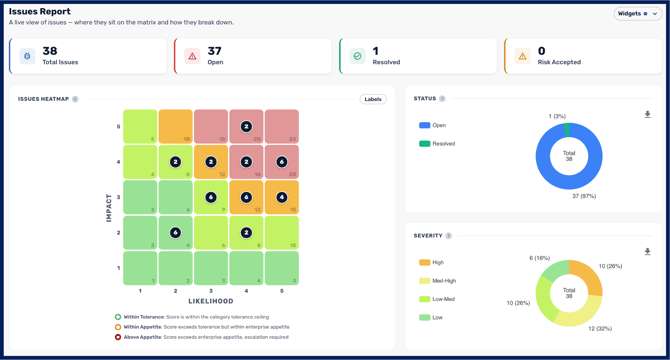
The KPI cards and summary
At the top of the report, KPI cards give you the headline counts for Total, Open, Resolved, and Risk Accepted issues. Selecting a card opens a popover with a Go to Register option that takes you to the Issues Register filtered to those issues, so you can move from the summary straight into the detail. Alongside the cards, a summary shows donut charts, your average days to resolve, issues created and resolved, and a breakdown by severity and status. These summary values reflect all of your issues and are not changed by the report filters.
The risk matrix view
The number of issues and their severity are plotted on your risk matrix, which is the same matrix you configure in your risk settings. This places your issues in the context of your risk posture, so you can see where the most serious issues sit rather than only how many you have.
Widgets
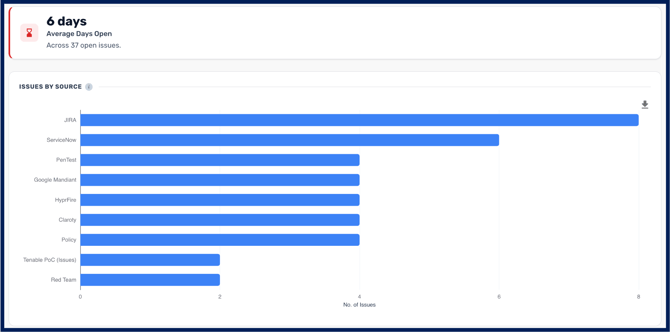
In addition to an overview of how your issues are plotted on your risk matrix, you also have other optional widgets that can provide additional insights into how your issues are being handled. By default you will also have sections for 'Status' and 'Severity', but you can also enable other reporting widgets from the 'Widgets' dropdown menu at the top right of the page. These include 'Issues by source', 'Team performance', 'Overdue/at risk', and 'Inadequate Controls'.
The Inadequate Controls widget, added in Release 2.7, surfaces the controls linked to your issues that are not performing effectively. Because linked controls now feed into risk control effectiveness, this widget makes it easy to see where your control gaps are concentrated across your issue backlog, rather than working through issues one at a time to find the pattern.
Filters
You can focus the report by selecting the Risk Categories to include, the Status (Open, Resolved, or Risk Accepted), the severity levels, and the start and end dates of the reporting period. These filters shape the timeline and breakdown views below, while the top summary stays based on all issues.
The timeline
The timeline charts the number of issues by status and their impact on risk across the reporting period. You can toggle the legend to add or remove lines, click and drag across the chart to zoom into a slice of time, and use the Home icon to return to the full period.
A note on historical accuracy. CyberHQ began recording daily snapshots of your issue counts at a point in time, and the timeline is exact from that point forward. For any period before it, the chart reconstructs history by assuming each issue always had the status it has now. That approximation is usually close, but it will understate how long issues sat open in the earliest part of a long reporting period. Worth knowing if you are presenting a multi-year trend.
The Risk Category breakdown
This breakdown shows, for each Risk Category, how many of its issues are Open, Risk Accepted, or Resolved. The legend is clickable, so you can choose which of these to view.
The issues scoreboard
The scoreboard lists every issue logged in your workspace, ordered by its impact on your Cyber Resilience score. Clicking the settings wheel opens a column selector so you can control how much detail the table shows and which columns to include when you export it.
Read together, the Issues Report shows not just how many issues you have but how they are trending and what they are costing your posture, and it links straight back to the register so you can act. For working with individual issues, see How to Manage an Issue, and for the parameters and download options common to every report, see Getting Started with Reporting.