The Executive Report is a board-ready summary of your organisation's cybersecurity posture, designed to brief leadership in one place. Release 2.8 rebuilt it around the decisions leadership actually makes: a scorecard giving an instant read on overall posture, and collapsible sections you open for the area under discussion rather than scrolling past everything else. You find it under Reports > Executive.
Generating the report
- From the lefthand navigation menu, click Reports > Executive.
-
Define the time period and Report Style you want using the filtering options beneath the Posture Scorecard. Report Style selects which of the report's sections appear, and there are five: Board Brief, CISO View, Risk Focus, Operations and Full Report. Choose the one that matches the conversation you are preparing for rather than showing everything and scrolling past most of it.
You can also build a custom view by choosing which sections are visible and which start expanded. Custom views are saved in your own browser, so they follow you between reports but not between machines, and they are cleared if you clear your browsing data.
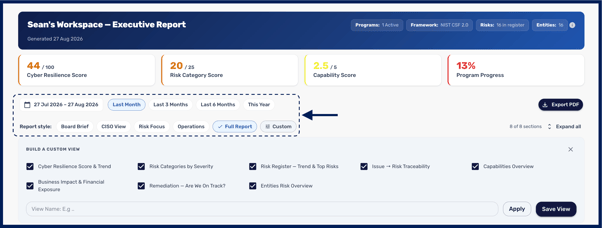
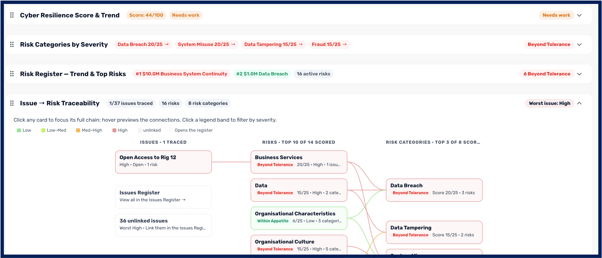
- Once you've selected your 'Report Style', up to 8 collapsible sub-reports will be displayed for you to view:
The cards and scores differ based on the Primary framework selected. To change the scores, see 'How to set and update security frameworks'
The posture scorecard
A scorecard sits pinned at the top of the report and stays visible as you work through the sections beneath it, so the headline position is always in view during a discussion. Clicking on any of the four tiles will take you to the related report informing that metric:

The report sections
The body of the report is organised into collapsible sections, each covering one area executive leadership need to be informed on:
-
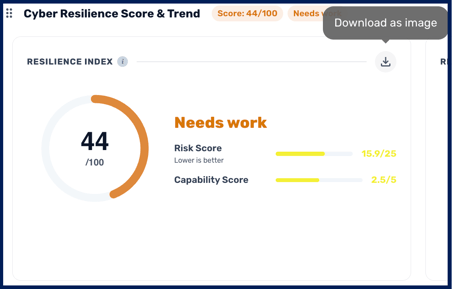
Cyber-Resilience and Score Trend — Reporting your organisation's current resilience based on the average of your combined risk score and capability score. How your organisation is trending in this area over time is also reported once enough changes to either score have occurred over time.
Reading the resilience trend across a methodology change. If your workspace has been on CyberHQ for a while, part of this trend predates the current risk scoring methodology. Where that is the case, CyberHQ reconstructs the earlier period using the previous approach and shows a banner on the chart telling you so. The two calculations measure different things, so you may see a visible step in the line where they meet. That step reflects the change in how risk is measured, not a change in your posture, and it is worth saying so out loud if you are presenting the trend to a board.
Where neither calculation can produce a figure, the line shows a gap rather than dropping to zero. A resilience score of zero would read as a crisis, so CyberHQ does not draw one it cannot substantiate.
-
Risk Categories by Severity — Covering your current likelihood and impact scores for top level risk categories in order of criticality, displaying how they've trended over time, and where they currently sit on your risk matrix.
-
Risk Register - Trend and Top Risks — Lists your top individual risks by financial exposure, and also the quantity of risks at different levels of severity over time.
-
Issues - Risk Traceability — Provides a map of how your issues flow through into their risks, and how those risks feed into your different risk categories.
-
Capabilities Overview— Provides a top level summary of the overall score for all of your existing frameworks, and also how your current control scores for your primary framework are measuring against your defined targets.
-
Business Impact & Financial Exposure — Summarises your documented financial impacts for the selected period against your risk categories.
-
Remediation - Are we on track? — Provides a summarised overview of your currently enabled 'Strategy', covering activities over time, and changes to control maturity and risk likelihood over time in order to visualise how actions are affecting overall resilience over time.
-
Entities Risk Overview — Collates your metrics on third-party risk management findings and assessment statuses. This report also highlights sensitive data areas based on what your vendors are reportedly handling.
Together these reports give you a single, current view to take to the board. For the parameters and download options shared across all reports, see Getting Started with Reporting.
Downloading the report and Individual Tables
At the top of the page, just beneath the Posture Scorecard, there is an option to 'Export PDF' that will provide you with a download of the report with your current filters applied.
If a section is still loading when you click Export, the download will not start. This is deliberate: a board PDF containing a placeholder zero is worse than waiting a moment, so CyberHQ refuses to export until every visible section has its real numbers. Give the page a few seconds and try again.
Certain graphs within different reports can also be downloaded from the 'download' icon in the corner of their relevant block.