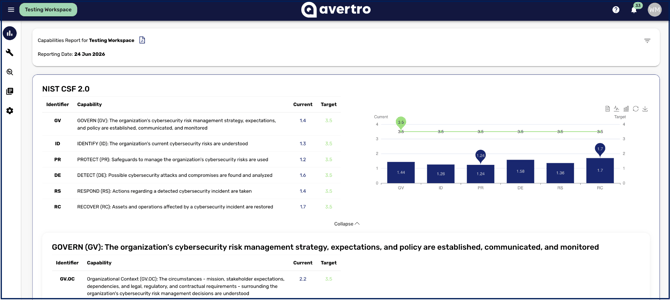
The Capabilities Report, under Reports > Capabilities, presents your maturity against your chosen framework, from your overall score right down to a single control. It matters because it turns the scoring you do in your Capabilities Assessment into a shareable view of where you are mature and where you need work, against any framework and across any point in time. This article explains how to read it.
Setting your parameters
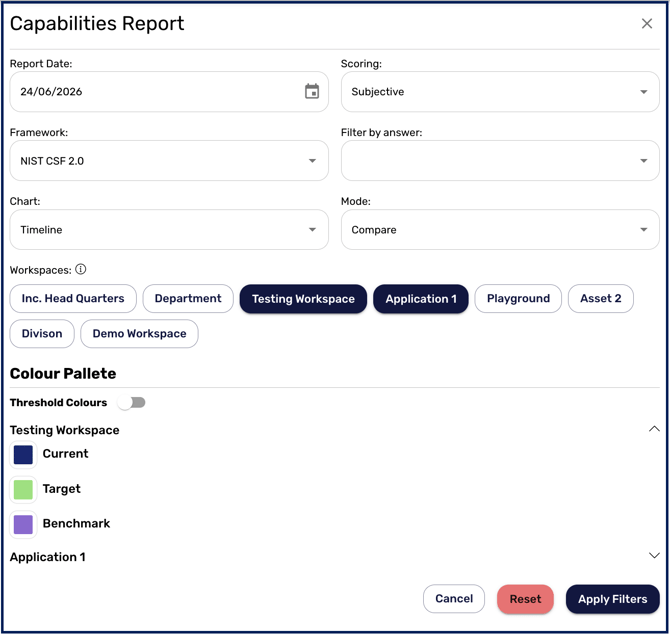
Choose the reporting date (or use Today for the current date), and select the framework you want to view your capabilities against. You can turn on Show Notes to include the notes captured during your assessment, and Show Locked & N/A Controls to include locked and not-applicable controls. The report refreshes dynamically as you change these.
A report dated today reads your live scores. A back-dated report reads the nearest daily snapshot at or before that date, which is why a historical figure can differ slightly from what you remember seeing on the day. Where a framework had not been set up before the date you chose, its score shows as a dash rather than zero, so an empty cell means "not yet measured" rather than "measured at nil".
Choosing how to view your scores
You can visualise your capabilities using four chart types: radar, column, bar, or timeline. Whichever you choose, use the arrow icon to drill from the topmost domain or category down through subcategories to an individual control, so you can move between the headline score and the detail behind it.
Comparing across workspaces
When you select multiple workspaces, you can aggregate or compare them. The aggregate view shows a single chart for each domain, category, and control, averaged by default or weighted using the slider. The compare view shows the selected workspaces side by side for each domain, category, and control, and is available on the bar and timeline charts.
The timeline view
Select Timeline from the chart type to see how your maturity has changed over the reporting period. Click and drag across the chart to zoom into a specific timeframe, and use the restore icon in the top right to return to the full period.
Read together, the Capabilities Report lets you present your maturity at whatever level your audience needs, against the framework that matters to them, and track how it is improving. For the scoring behind it, see How to Assess your Capabilities, and for the parameters and download options common to every report, see Getting Started with Reporting.