
Running a simulation shows how adding resources or implementing controls would change your risk against a scenario, and the summary turns that change into a financial case. This is what lets you justify a cyber investment with quantified risk reduction and a clear return on investment. This article covers running a simulation and reading its summary.
Running a simulation
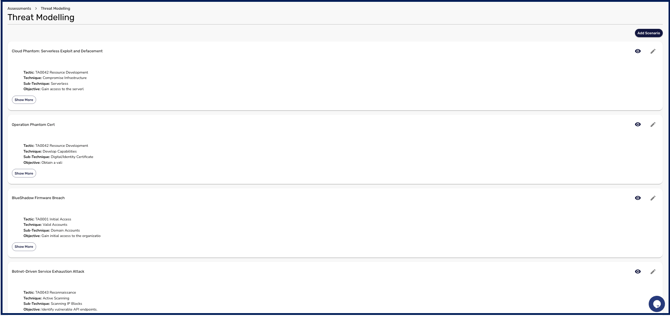
- Navigate to Assessment > Threat Modelling and select the eye icon on the threat scenario you want to simulate.
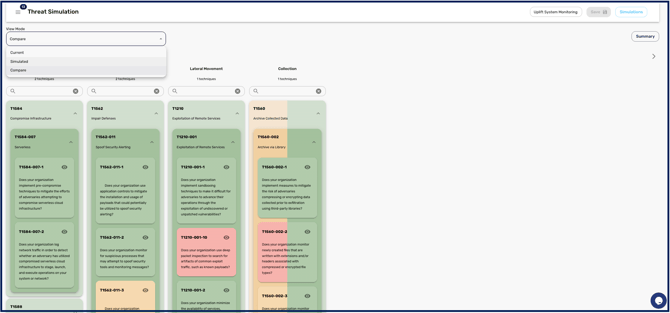
- On the Threat Scenario page, open the Threat Menu. From here you can also toggle the View Mode between your current state, the simulated state, and a comparison, open the Summary page, and load previously saved simulations from the simulation drawer.
- Work across the Threat Menu's two pages. Resources are populated from your Security Resources catalogue, and Controls from the Master Control Framework. Active resources are those linked to Key Business Systems and recommended resources are not, while implemented controls are those marked Yes in your Capabilities Assessment and un-implemented controls are marked No.
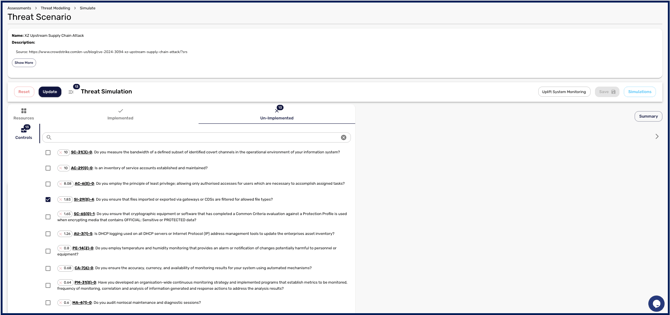
- Check and uncheck the resources and controls you want to model, then press Simulate.
- The dashboard switches to Compare mode, showing the effect of your simulated resources and controls on the threat.
Resources need costs associated with them for the simulation to produce a financial summary. You can edit a resource's cost from the Threat Menu using the expand icon and then the pencil icon.
Interpreting the summary
The Summary page presents the result two ways. The Exposure tab gives you the headline numbers:
- Total Cost: the complete investment to implement the mitigation, summing the capital, non-recurring, and operational costs of the selected resources.
- Financial Impact: the estimated reduction in expected loss, calculated as the difference in expected loss with the mitigation versus without it.
- Return on Investment: the Financial Impact minus the Total Cost, showing the net value of the change.
A Risk Impact table compares your current and simulated risk impact. The Quantification tab then visualises this as two curves: a Current Loss Curve, which is your baseline if you take no new action, and a Simulated Loss Curve, which shows your projected losses after the resources and controls are in place. The gap between the two is the risk reduction that drives your Financial Impact and ROI.
How to present these numbers. The summary carries an on-screen notice that its figures use an earlier risk scoring method, which an enhanced Risk Reporting module is expected to replace. Treat them as a well-founded comparison between two options rather than an absolute valuation: the gap between the two curves is the meaningful output, not either figure on its own. If you are putting this in front of a board, present it as the relative case for a change.
These figures are also unrelated to those produced by Risk Quantification, which runs a different calculation from inputs you supply by hand. The two features share a chart, which makes them look comparable. They are not, and their numbers should never be reconciled against each other.
Read together, these figures give you a defensible, quantified case for the change, so you can direct your security investment where it reduces the most risk for the cost.