
CyberHQ's reports turn the data you have entered across the platform into shareable views of your security posture, from a board-ready summary down to detailed breakdowns of your risk, maturity, issues, and third parties. You find them under the Reports menu. This article explains the reports available and the controls common to all of them, so you can generate and share the right view for your audience.
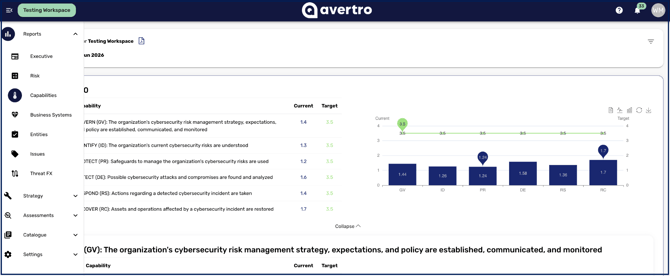
CyberHQ Reporting Categories
CyberHQ provides a report for each major part of your posture:
- Executive Report: a board-ready summary of your overall cybersecurity posture, covered in Understanding the Executive Report.
- Risk Category Report: Category-level risk scoring drawn from the Risk Register, with trends over time and category comparison, covered in Understanding the Risk Category Report.
- Capabilities Report: your maturity against your chosen framework, from the overall score down to a single control, covered in the Capabilities Reporting section.
- Issues Report: a summary of your issues and their impact on risk over time, covered in the Issues Reporting section.
- Entities Report: the status and progress of your third-party assessments, covered in the Entities Reporting section.
- Business Systems Report: an overview of your essential systems and the details recorded against them.
- Threat FX: an aggregate view of the threat techniques across your threat scenarios.
Your strategy and program progress are reported within the Strategy module rather than as separate reports here.
Setting your reporting parameters
Most reports let you tailor what you see before generating them. Click the v icon at the top right of a report to set the reporting date or period, after which the report updates dynamically, and to choose which workspaces to view or compare. Use the Today option to jump to the current date, and apply any report-specific filters, such as chart type or which categories to include.
Downloading and sharing reports
Once your parameters are set, you can export a report to share it. Print a report using Ctrl+P, or use the PDF icon on the Executive Report to preview and download it as a PDF. For table-based reports, you can choose which columns to include when downloading by expanding the column selector.
From here, each report's dedicated article explains how to read and act on what it shows.