
The connector builder is where you assemble an automation from nodes to pull data in and shape it for CyberHQ. This article covers creating an automation, the nodes you build with, using variables, inspecting the data moving through a node, and running an automation on a schedule.
Creating an automation
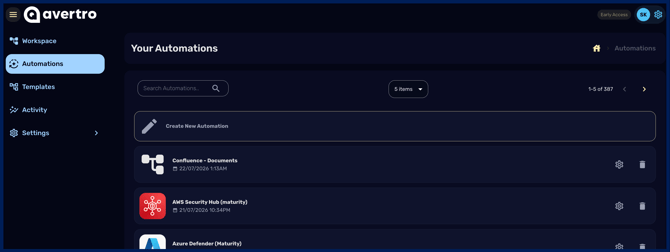
- From the navigation menu, select Automations, then click Create New Automation. You can start from a template, which gives you an editable copy, or from a blank workspace.
- Once the automation is built, click Run (under the settings icon next to the automation) to import its data into CyberHQ. A green pop-up confirms success, and a red pop-up indicates an error.
- To debug a failing automation, select it and click Test Node on each node. Nodes that pass show a green box, while nodes that fail show a red error message, so you can see exactly where the problem is.
The nodes you build with
Automations are assembled from nodes, each performing one job: Webhook (a triggerable public endpoint), HTTP (POST/GET/PUT requests), Switch (branch the flow on conditions), Filter (drop data that fails conditions), Mapping (reshape data into CyberHQ's models), Aggregate (compute and group), Transform (custom code), and Controls (align data to Master Control Framework controls). These are described in CyberHQ Connect Overview.
Using variables
- Go to Settings and select Variables, then click New Variable.
- Enter the variable's name and value and click Create. It then appears in your Environment Variables list.
- To use it in an automation, click inside a text box, type ENV. to list your variables, and select the one you want.
Viewing incoming and outgoing data
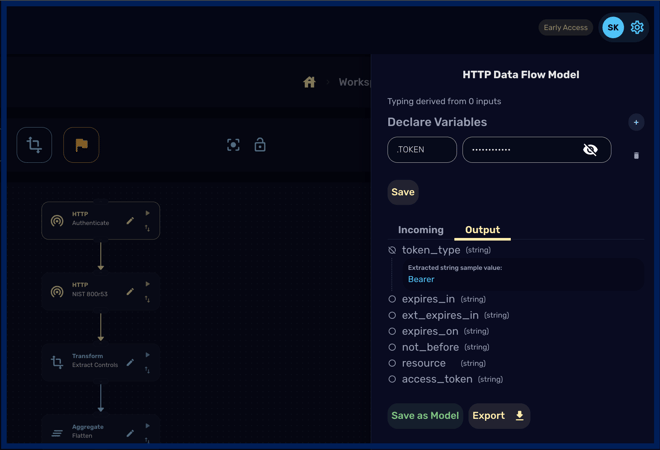
- On the Your Automations page, open the automation and click Test Node through to the node you want to inspect, making sure each node has run successfully.
- On that node, select the View Data Flow icon (the two arrows) to see the structure of both the incoming and outgoing data. You can also export the JSON for each to view the full datasets.
Running an automation on a schedule
- On the Your Automations page, click the settings icon next to the automation, then toggle Run Automation On Schedule on.
- Set the frequency (Daily, Weekly, or Monthly), the time it should run, and, for Weekly or Monthly, the days to run on.
- To confirm a scheduled run, go to the Activity section and open the Execution Records page, which lists every automation you have run. Open a run with the arrow-in-a-box icon to see which nodes succeeded or failed, the date and time, each node's duration, the tokis consumed, and the input and output per node.
With these tools you can build an automation, prove each node works, and keep it running on a cadence that suits your data. For guidance on doing this well, see Best Practices for Building Connectors.